OSU-OKC at A Glance
Fall Census Data 2019-2023
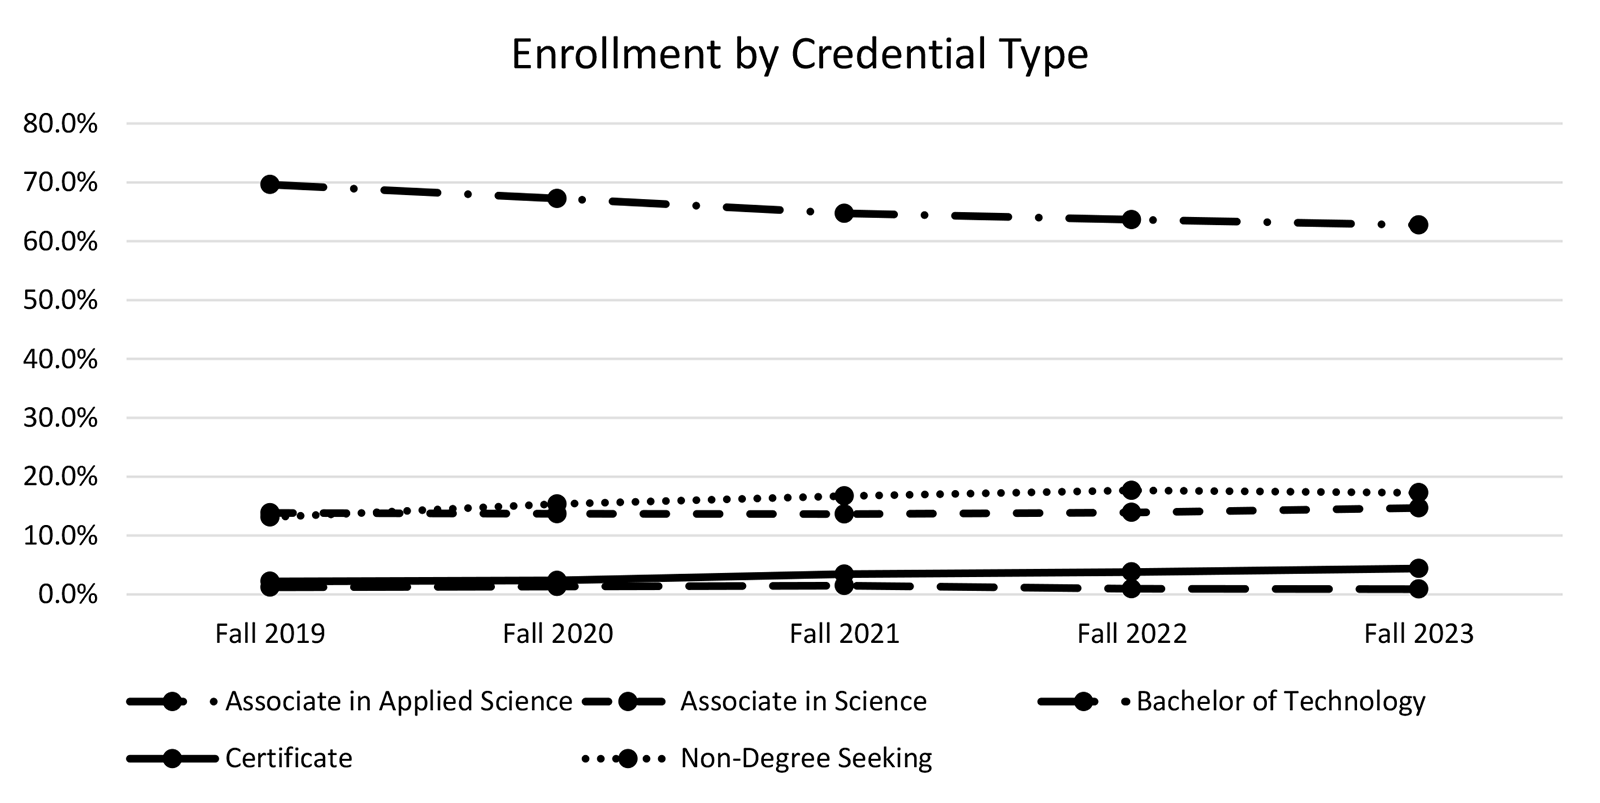
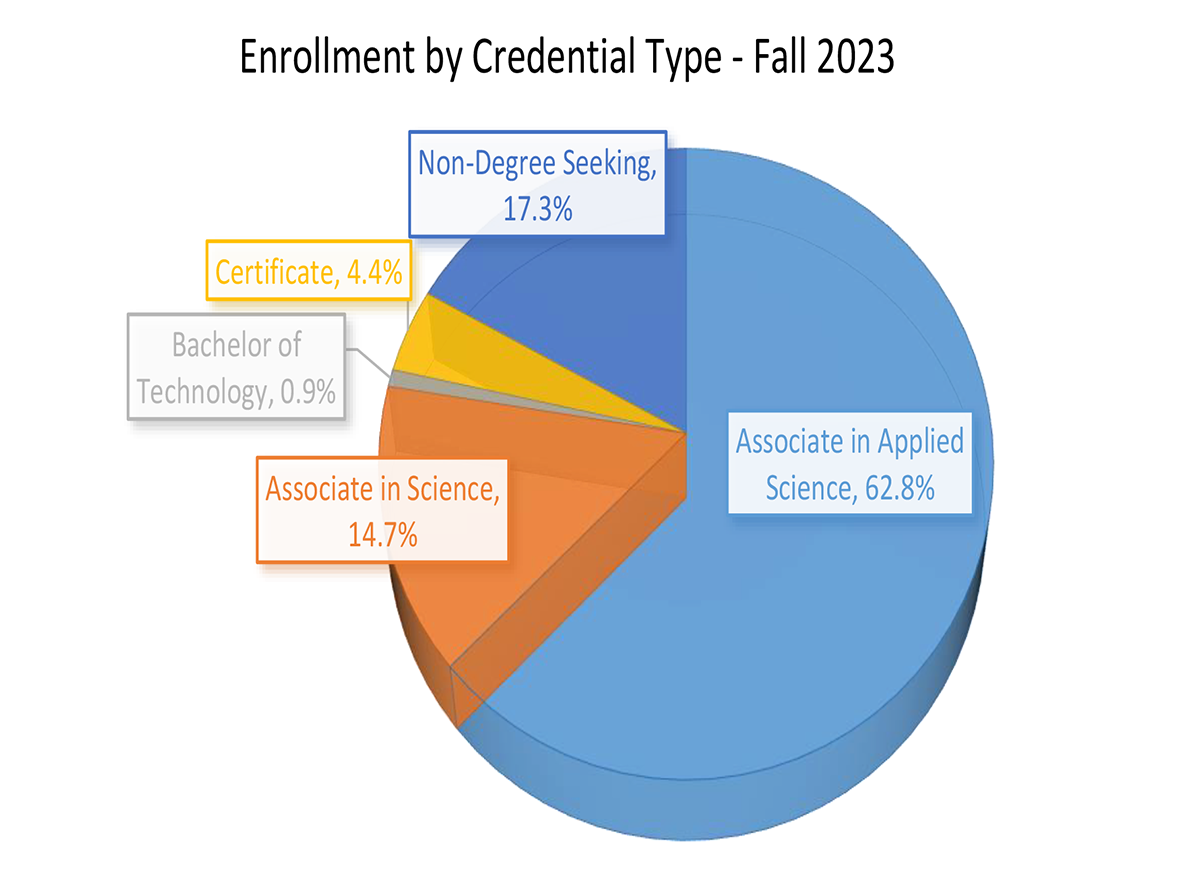
Enrollment by Credential Type
| Fall 2019 | Fall 2020 | Fall 2021 | Fall 2022 | Fall 2023 | ||||||
| Count | % of Total | Count | % of Total | Count | % of Total | Count | % of Total | Count | % of Total | |
| Associate in Applied Science | 3,725 | 69.60% | 3,328 | 67.20% | 2,884 | 64.70% | 2,763 | 63.70% | 2,598 | 62.80% |
| Associate in Science | 741 | 13.80% | 678 | 13.70% | 608 | 13.60% | 604 | 13.90% | 608 | 14.70% |
| Bachelor of Technology | 65 | 1.20% | 66 | 1.30% | 66 | 1.50% | 41 | 0.90% | 37 | 0.90% |
| Certificate | 118 | 2.20% | 117 | 2.40% | 153 | 3.40% | 165 | 3.80% | 182 | 4.40% |
| Non-Degree Seeking | 702 | 13.10% | 760 | 15.40% | 745 | 16.70% | 767 | 17.70% | 715 | 17.30% |
| Total | 5,351 | 100% | 4,949 | 100% | 4,456 | 100% | 4,340 | 100% | 4,140 | 100% |
Fall Census Data 2019-2023
Graphic represents data provided in table above.
Fall Census Data 2019-2023
Graphic represents data provided in table above.
Fall Census Data 2019-2023
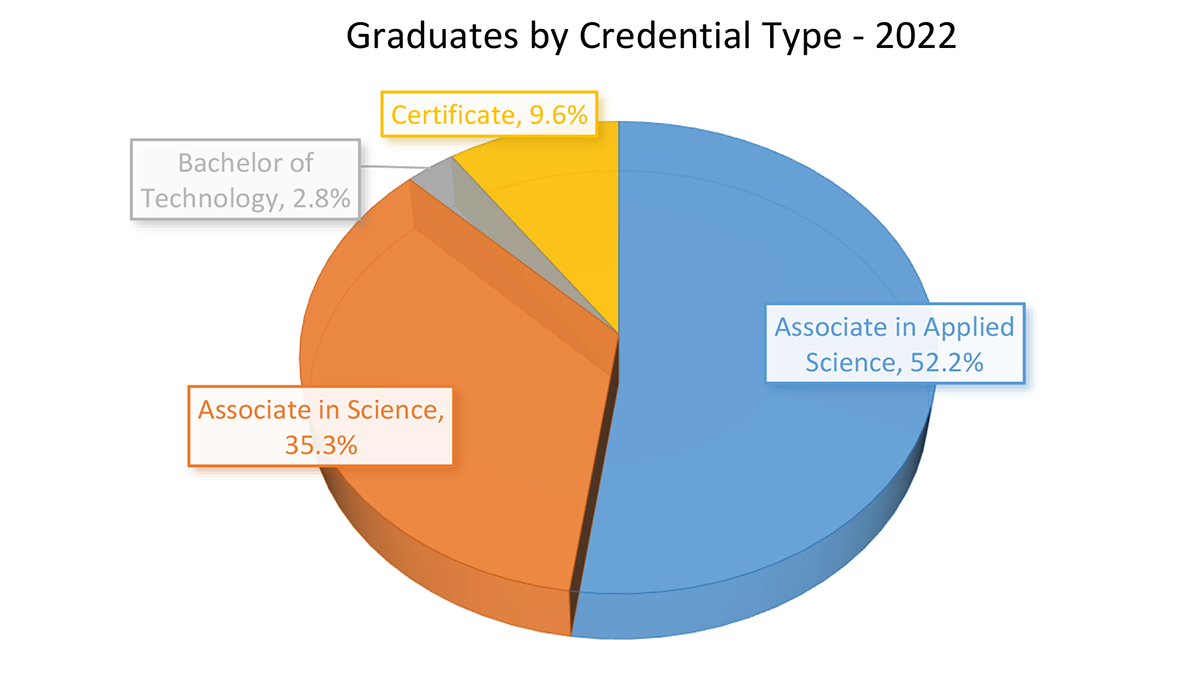
Graduates by Credential Type
| 2018 | 2019 | 2020 | 2021 | 2022 | ||||||
| Count | % of Total | Count | % of Total | Count | % of Total | Count | % of Total | Count | % of Total | |
| Associate in Applied Science | 491 | 52.60% | 468 | 49.00% | 465 | 50.10% | 472 | 51.10% | 407 | 52.20% |
| Associate in Science | 358 | 38.40% | 387 | 40.50% | 377 | 40.60% | 356 | 38.60% | 275 | 35.30% |
| Bachelor of Technology | 15 | 1.60% | 16 | 1.70% | 23 | 2.50% | 20 | 2.20% | 22 | 2.80% |
| Certificate | 69 | 7.40% | 85 | 8.90% | 64 | 6.90% | 75 | 8.10% | 75 | 9.60% |
| Total | 933 | 100.00% | 956 | 100.00% | 929 | 100.00% | 923 | 100.00% | 779 | 100.00% |
Fall Census Data 2018-2022
Graphic represents data provided in table above.
Fall Census Data 2019-2023
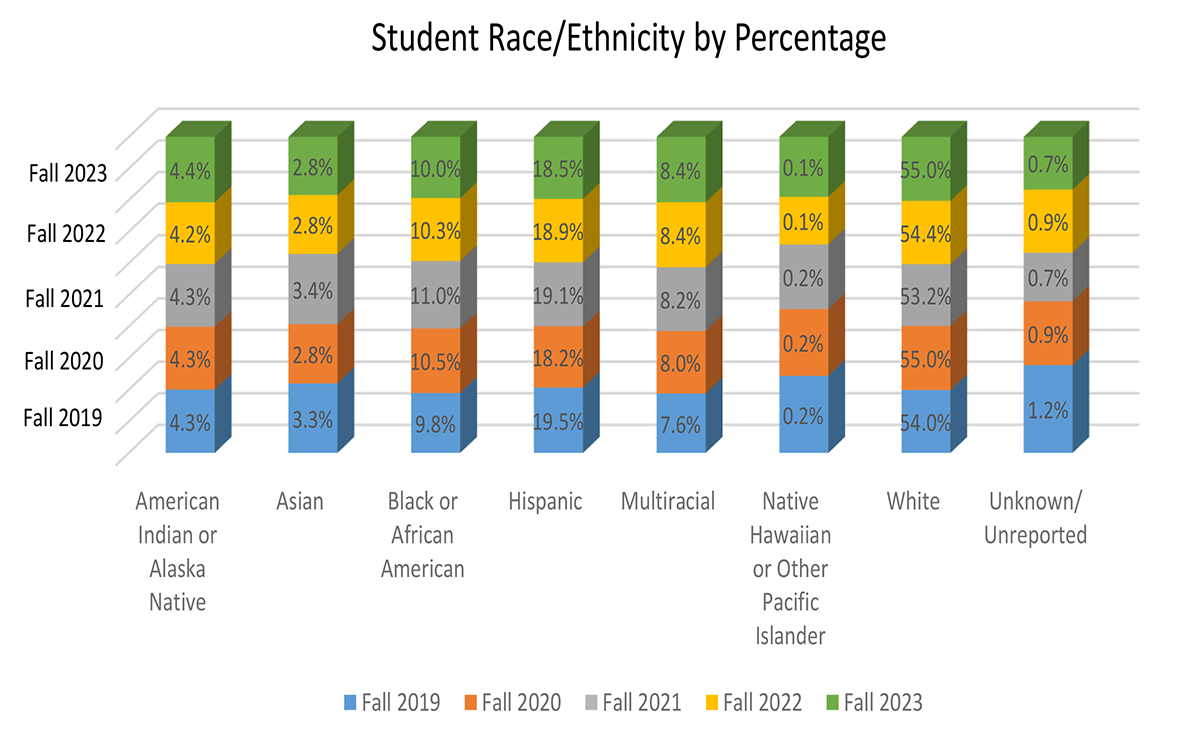
Student Race/Ethnicity
| Fall 2019 | Fall 2020 | Fall 2021 | Fall 2022 | Fall 2023 | ||||||
| Count | % of Total | Count | % of Total | Count | % of Total | Count | % of Total | Count | % of Total | |
| American Indian or Alaska Native | 231 | 4.30% | 212 | 4.30% | 191 | 4.30% | 182 | 4.20% | 184 | 4.40% |
| Asian | 178 | 3.30% | 140 | 2.80% | 150 | 3.40% | 122 | 2.80% | 115 | 2.80% |
| Black or African American | 525 | 9.80% | 523 | 10.50% | 492 | 11.00% | 446 | 10.30% | 414 | 10.00% |
| Hispanic | 1,044 | 19.50% | 905 | 18.20% | 853 | 19.10% | 821 | 18.90% | 764 | 18.50% |
| Multiracial | 410 | 7.60% | 398 | 8.00% | 367 | 8.20% | 363 | 8.40% | 348 | 8.40% |
| Native Hawaiian or Other Pacific Islander | 10 | 0.20% | 8 | 0.20% | 7 | 0.20% | 5 | 0.10% | 6 | 0.10% |
| White | 2,896 | 54.00% | 2,728 | 55.00% | 2,376 | 53.20% | 2,360 | 54.40% | 2,275 | 55.00% |
| Unknown/Unreported | 67 | 1.20% | 45 | 0.90% | 31 | 0.70% | 39 | 0.90% | 31 | 0.70% |
| Total | 5,361 | 100% | 4,959 | 100% | 4,467 | 100% | 4,338 | 100% | 4,137 | 100% |
Fall Census Data 2019-2023
Graphic represents data provided in table above.
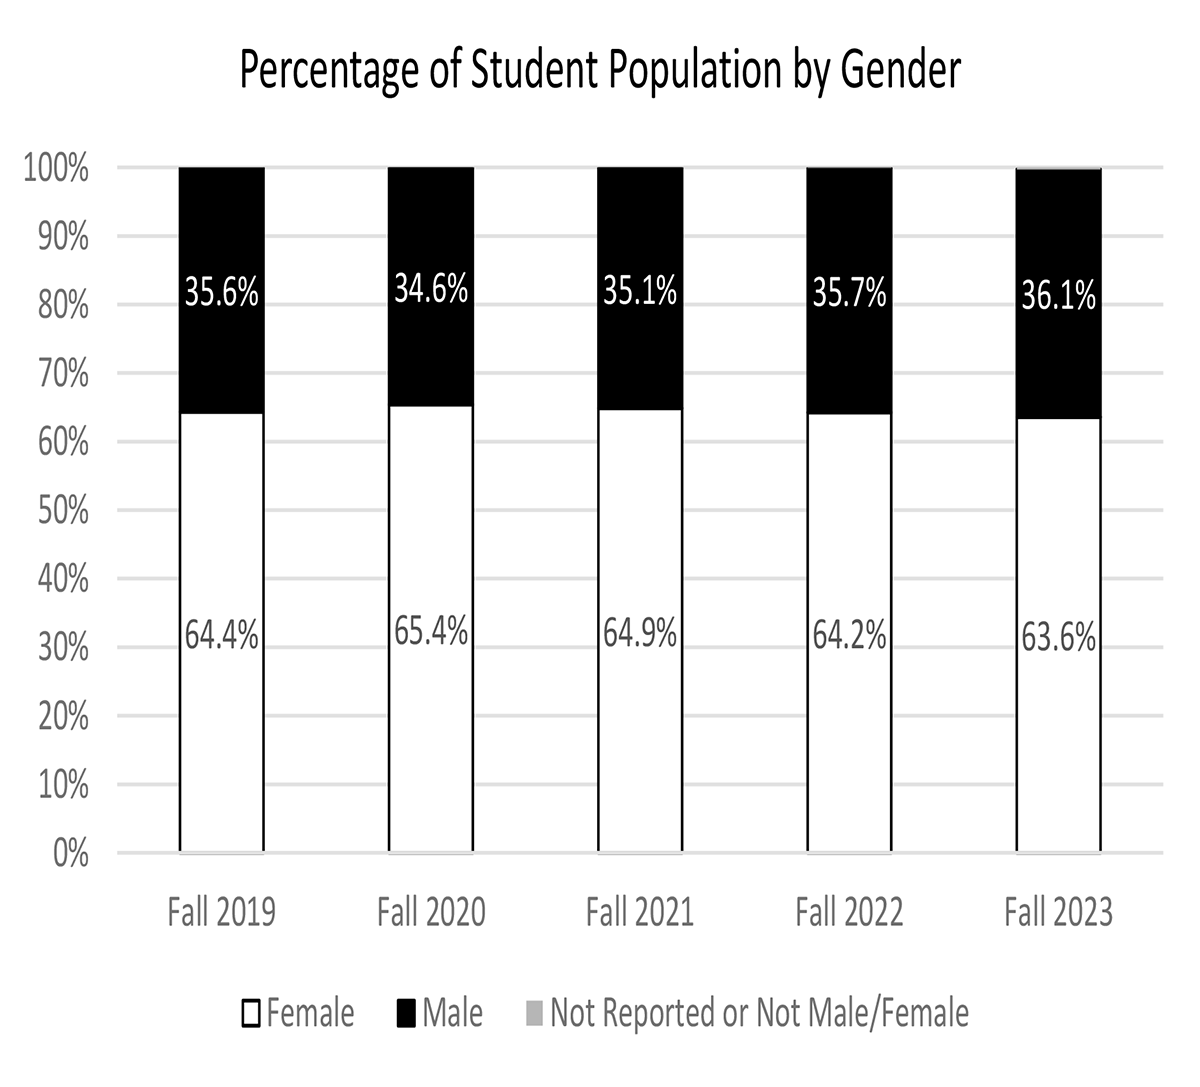
Fall Census Data 2019-2023
Graphic represents data provided in table above.
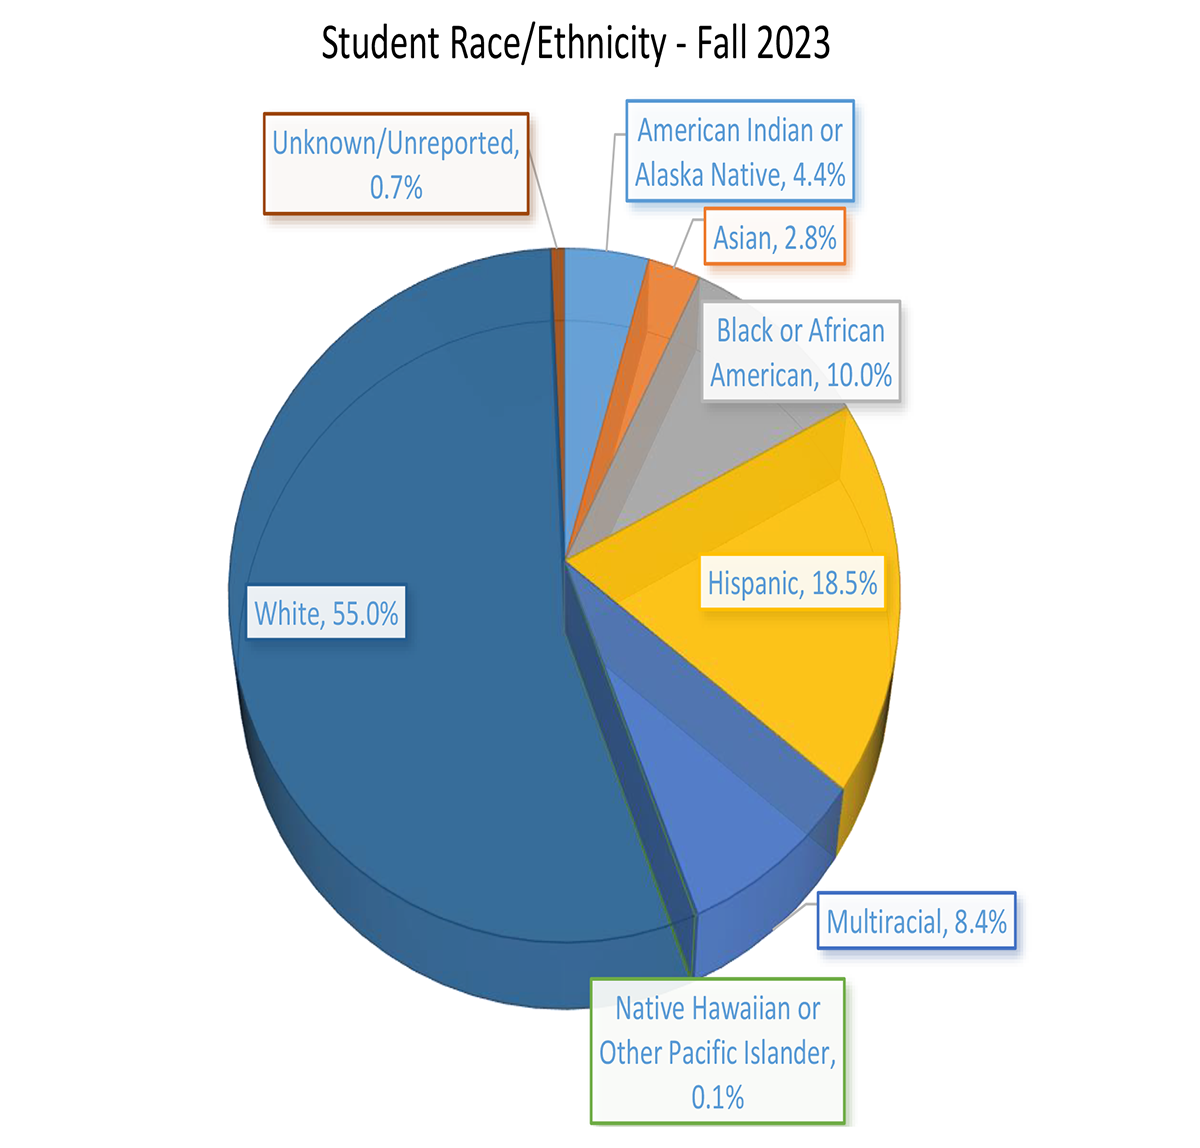
Fall Census Data 2023
Graphic represents data provided in table above.
Fall Census Data 2019-2023
For more information...
contact OSU-OKC Institutional Effectiveness and Accreditation, okc.accreditation@okstate.edu.